STRUCTURES Blog > Posts > The Structure of STRUCTURES
STRUCTURES Blog > Posts > The Structure of STRUCTURES
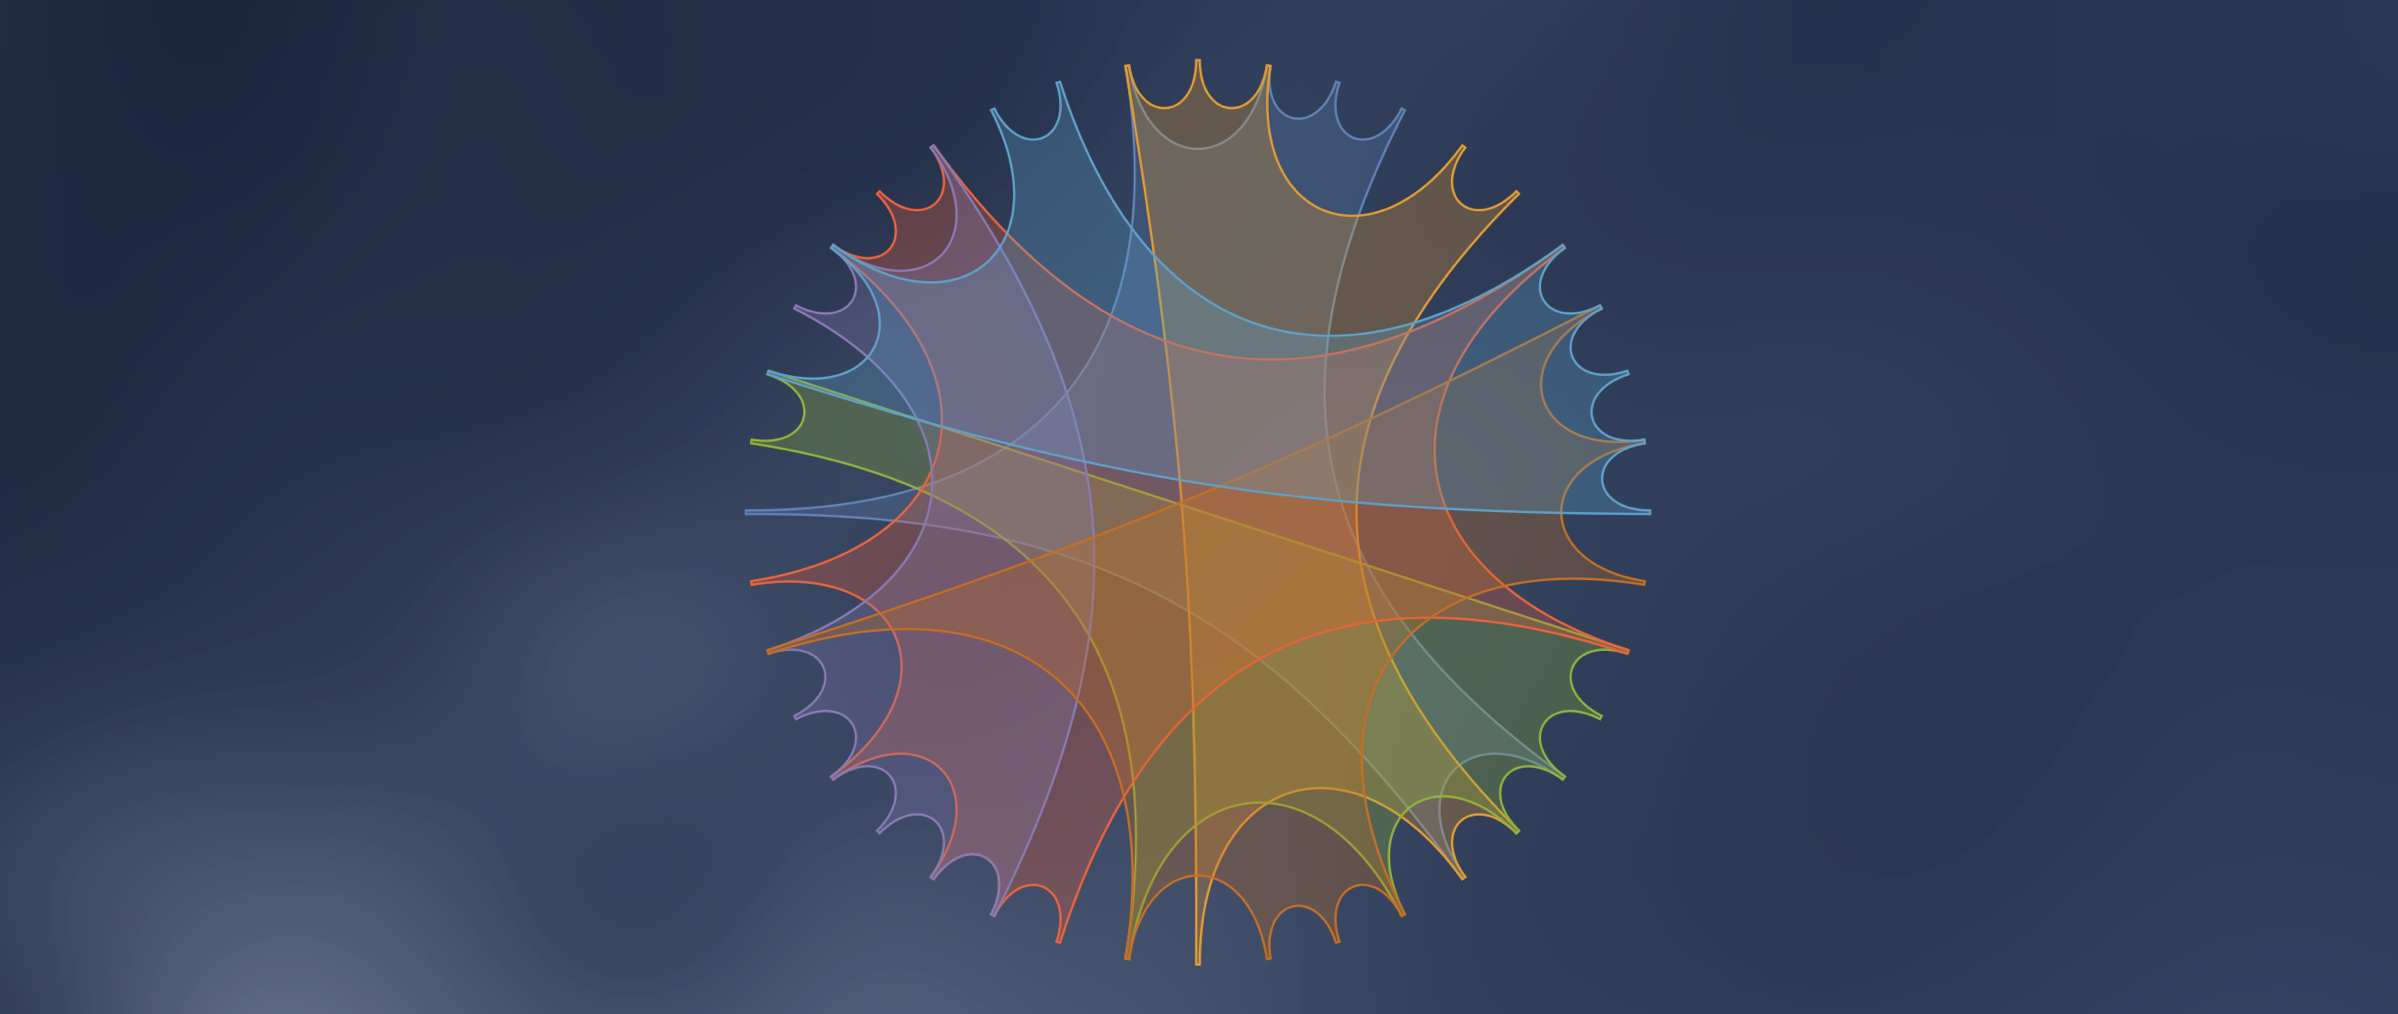
This structure arises in a visualisation of connections between entities (such as people or countries). It is useful when the individual entities can be associated to groups. Every individual may belong to more than one group. Being in the same group means being connected. We then draw a polygon with corners associated to the individuals that are in the same group.
We all know polygons in the Euclidian plane: triangles, quadrangles, pentagons, hexagons, etc.
They are obtained by joining points by straight lines. Given any two points, the straight line through these points is the shortest path that connects them – in the Euclidian metric that we are used to from everyday life. Such shortest paths are called geodesics.
To obtain our visualisation of these groups of people, we drew the polygons differently. We placed the names of people around a circle, and put a hyperbolic metric on the disk that is bounded by this circle. (The disk with this metric is called the Poincaré disk in honour of the French mathematician Henri Poincaré.) The hyperbolic metric corresponds to a space of constant negative curvature, and therefore shortest paths do not appear as straight lines when drawn in the picture. As a consequence, the polygons in the hyperbolic disk look different – they bound the coloured areas in the picture.
Our reasons for using the hyperbolic metric were aesthetics and visual clarity: ordinary (Euclidian) polygons with many corners have obtuse angles, and are therefore less easy to separate visually.
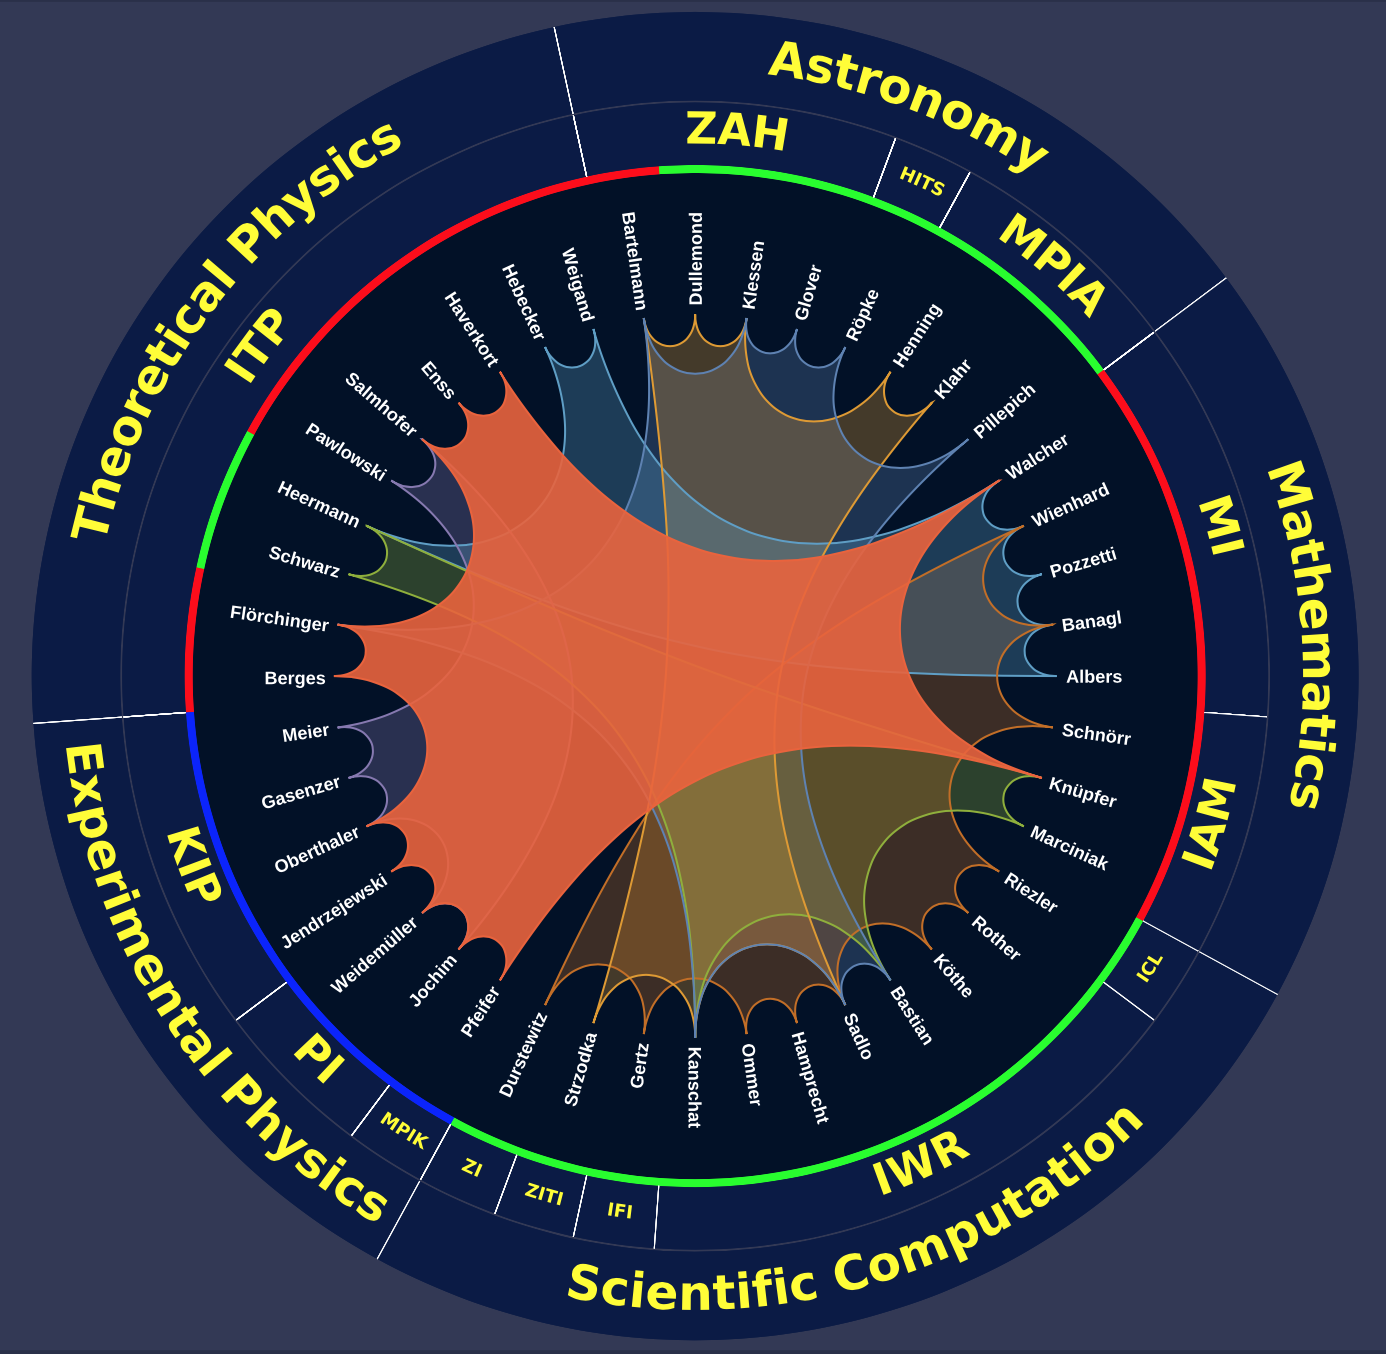
We invented this visualisation when thinking how to depict, in a single diagram, the seven comprehensive projects (CPs) within the Heidelberg research cluster STRUCTURES (for more information, see https://structures.uni-heidelberg.de). The CPs are joint interdisciplinary projects that connect researchers rooted in a variety of areas of physics, mathematics, astronomy and computer science. Arranging the researchers around a circle, as it is done in the diagram, not only emphasises that in the CP, they all contribute jointly and on an equal footing, it also allows to show the different subject areas, affiliations, as well as other information, on further circles on the outside.
When our cluster proposal was successful in the German Excellence Strategy in 2018, we
chose this diagram as its logo.
The python source code is provided by Kambis Veschgini and Manfred Salmhofer under the zlib license, on https://github.com/Veschgini/HyperColl.
About the Author:
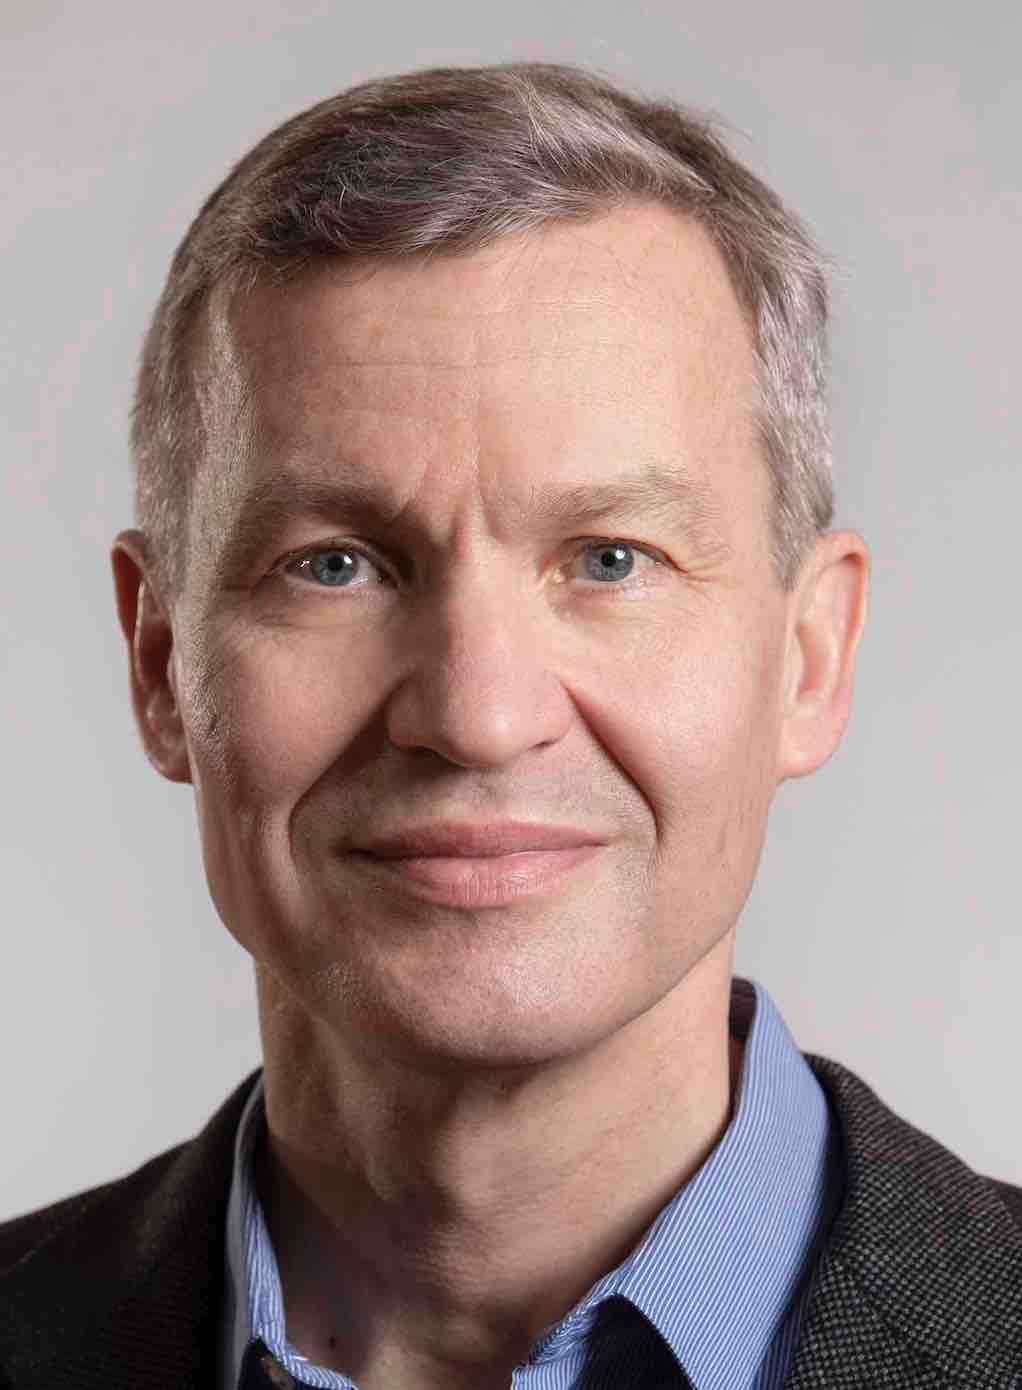
Manfred Salmhofer is Professor in the Departments of Physics and Mathematics at Heidelberg University and speaker of the STRUCTURES cluster. His area of expertise is theoretical and mathematical physics.
Tags:
Geometry
Hyperbolic
Learn more about STRUCTURES and its projects on the main website.
Get to know the team behind this blog.